


TL;DR: Mason demonstrates how to use Substreams data to create a dynamic treemap visualization for blockchain balance changes using D3.js and React.
Substreams is used to filter and reduce the vast amount of data coming from the blockchain in real time to the data that matters to your application.
Let’s follow along as Mason demonstrates how to use Substreams data to create a treemap visualization of blockchain balance changes.
You can use data from the Substreams to create a treemap visualization of balance changes on the blockchain. A treemap is a visual representation of hierarchical data using nested rectangles, where the size and color of each rectangle indicate different attributes of the data.
Building your treemap project involves a few essential steps, starting with setting up the right tools and obtaining necessary access credentials.
Setting up your account and API key
Create an account for the Pinax app. Once you’re registered, you can get an API key, which is essential for working with Substreams.
For more on the Pinax app, including a quick video demo, see our blog post, Introducing the New Pinax App, a Better Way to Manage Your Firehose and Substreams Services.
Leveraging D3.js for dynamic visualizations
Mason suggests using D3.js as a tool for making visuals because it’s flexible. As long as you have a good understanding of JavaScript, you can bring your data to life. D3.js can fit into any visual toolkit that works for your project.
Integrating frontend frameworks
To make sure the visualization always shows the newest data, consider using a frontend framework such as React.
React makes it easy to update the treemap when new data comes from the Substreams. This framework helps make user interfaces and will work well with your changing treemap.
Understand Substreams with JavaScript
To understand how the Substreams works, look at the examples in the substreams-node repository. The examples show how to use Substreams in your JavaScript code, giving you a good start on making your treemap.
Navigating the visualization treemap interface demo
The interactive treemap provides real-time updates on balance changes within various cryptocurrency accounts across Ethereum (ETH) and Polygon (MATIC) blockchains.
Each rectangle in the treemap represents a unique account, and the varying rectangle sizes indicate the magnitude of balance changes.
This tool is especially valuable for monitoring asset flow and identifying trends or unusual activity within the blockchain ecosystem.
Instructions on running this demo are in the repository’s README. You can see the results in the image below.
💡 This project uses D3.js for visualizing blockchain data with the Substreams treemap.
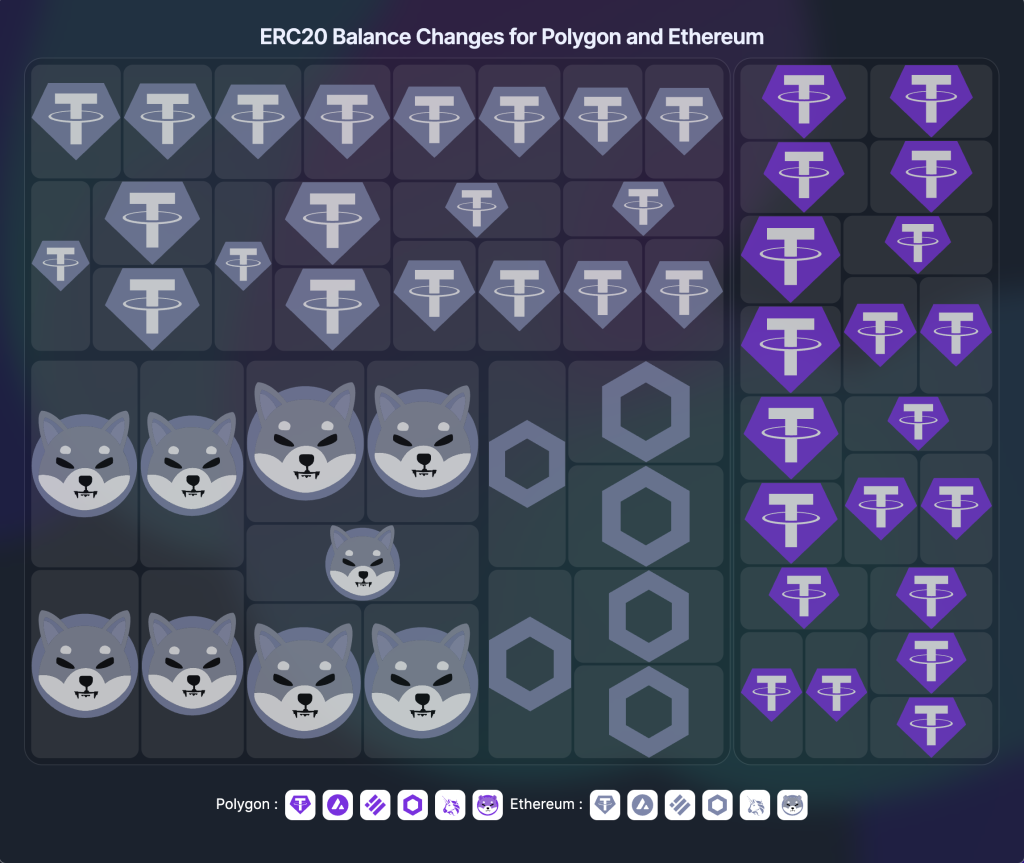
This treemap shows ERC-20 token balance changes for Polygon (left) and Ethereum (right) networks. Each token is represented by a specific icon: Tether (USDT), Shiba Inu (SHIB), Chainlink (LINK), Uniswap (UNI), and Aave (AAVE). Tile sizes indicate the magnitude of balance changes.
In the interface’s lower section, you’ll find Polygon and Ethereum text along with symbols for various other cryptocurrencies like Tether USDT and Uniswap.
- Identifying networks: Simply hover your cursor over these icons to display the names of the networks.
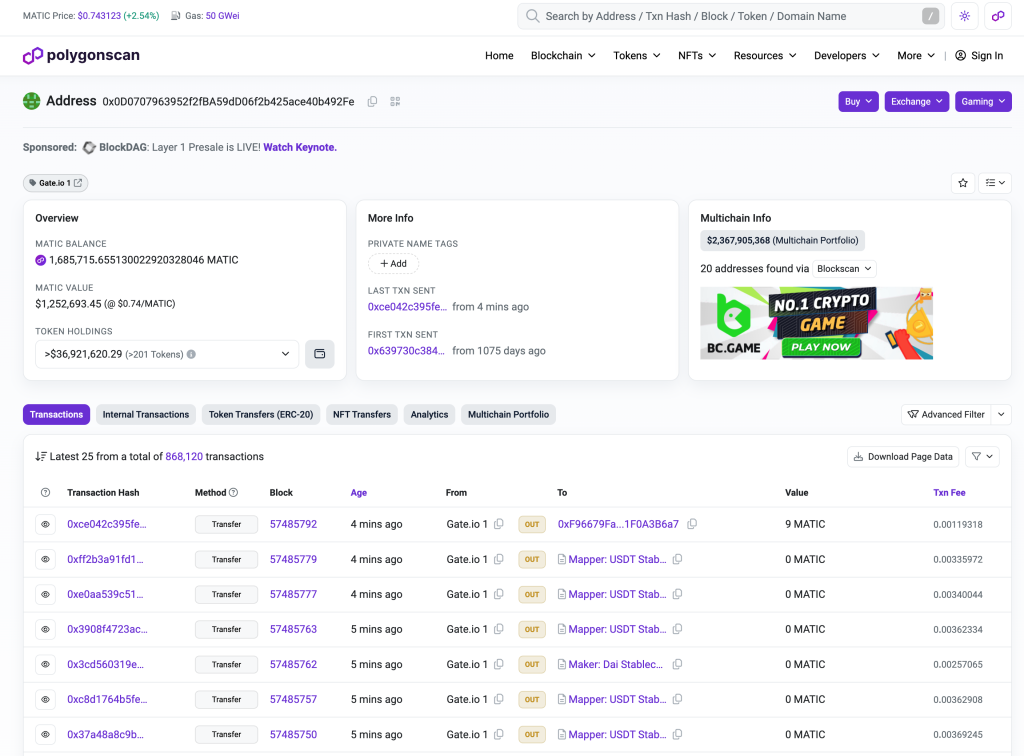
- Exploring asset details: To investigate balance changes for a specific asset, such as Tether USDT, select the corresponding Tether USDT icon. This action will redirect you to Polyscan, a blockchain explorer, where you’ll see detailed address information and balance history (as shown below).
See it in action
Substreams filters vast amounts of blockchain data to only what’s relevant for your application, providing an efficient way to monitor balance changes and trends. D3.js allows us to create dynamic and interactive treemaps that can be seamlessly updated with new data thanks to frontend frameworks like React.
Ready to see it in action? Check out the video above and dive into the repo to start building your own treemaps!
💡 This article answers questions like:
- How can a developer use Substreams?
- What is a treemap chart used for?
- What is D3.js used for?
- What is React used for?


No Comments